How many samples are needed for an Explore study to provide sufficient power in order to find signification protein signatures? Will power differ between Target 96 and Explore?
ower depends on sample size, effect size and significance level (alpha). Effect size is a standardized measure of the size of the difference we want to detect, and in turn depends on the size of that difference and spread (standard deviation) of the data. We recommend running a pilot study to be able to better adapt the settings to your particular data. Olink also provides a web-based application to assist in power calculation for a balanced t-test and balanced one-way ANOVA (https://insight.olink.com/tools/study-size-calculator). If we consider using a standard significance level as 0.05, and Bonferroni correction for multiple hypothesis testing, the more assays that are tested, the smaller the corrected significance level will be as can be seen in the plot below (Figure 1).
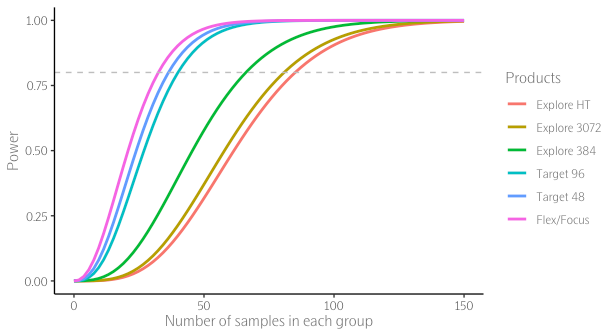
Figure 1. Power estimation from different Olink products using the parameters based on the normal range data. For Olink® Explore HT, Explore 3072, and Explore 384, the power is calculated based on two groups of samples with 0.5 NPX differences and a pooled standard deviation 0.6. For Olink® Target 96, Target 48, and Flex/Focus, the power is determined using two groups of samples with 0.5 NPX differences and a pooled standard deviation of 0.5. The dashed line indicates power equal to 80%.
In general, increased sample size means increased statistical power. However, it is important to note that power is decided by the smallest group so increasing the number of samples in one group does little for power. In other words, power is highest when groups have the same number of samples in them. This is known as a balanced design and is statistically advantageous.