Transparent validation for data you can trust
Limit of Detection (LOD)
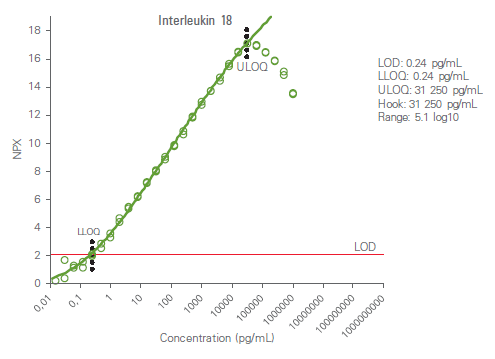
In vitro sensitivity (calibrator) curves using recombinant antigen are determined in multiplex format, for each of the 384-plex panels within Olink Explore. Note that in some cases, no suitable antigen is available and no calibrator data is presented. Limit of detection (LOD) is defined as 3 standard deviations above background and reported in pg/mL. The y-axis shows NPX above background, which is defined as the median of negative control measurements and used to define the expected background level (zero).
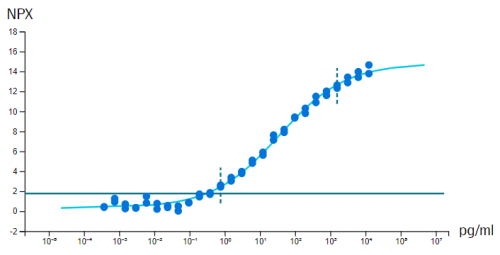
Example calibrator curve from assay validation
High dose hook effect
The high dose hook effect is seen when there is an antigen excess relative to the reagent antibodies, resulting in falsely low results. In such cases, a significantly lower value may lead to erroneous interpretation of results.
Therefore, the hook threshold is determined for each analyte and reported in pg/mL and this value is presented on each individual biomarker page.
Measuring ranges
The analytical measuring range is defined by the lower limit of quantification (LLOQ) and upper limit of quantification (ULOQ) and reported in pg/mL. Quantification limits of LLOQ and ULOQ are calculated using relative error <30% and CV <30%.
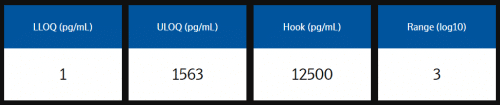
Example analytical measuring range data from assay validation
Sample distribution
The levels of protein measured in a number of commercial plasma samples are presented in sample distribution plots. Healthy subjects (n=24) and samples obtained from patients with a range of diseases (n=48). These include inflammatory, cardiovascular (n=12) , autoimmune (n=12) & neurological diseases (n=12), as well as cancer (n=12). These data provide a general idea of the NPX range to expect but cannot cover all potential levels in clinical samples. The y-axis shows NPX above background, which is defined as the median of negative control measurements and used to define the expected background level (zero).

Example sample distribution plot from assay validation
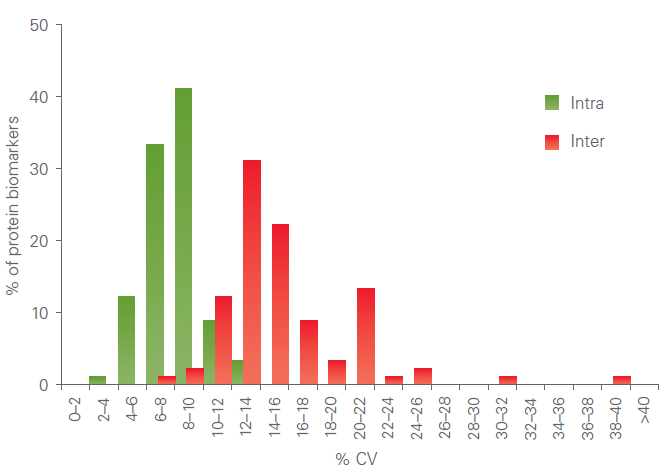
Precision
Intra-assay variation (within-run) is calculated as the mean CV for 6 individual samples, within each of 7 separate runs during the validation studies. Inter-assay variation (between-runs) is calculated as the mean CV, for the same 6 individual samples, among 7 separate runs during the validation studies.
Across the assays of Olink® Explore 384 Inflammation, Olink® Explore 384 Oncology, Olink® Explore 384 Cardiometabolic and Olink® Explore 384 Neurology panels, the mean intra-assay and the inter-assay variations observed were 8% and 11%, respectively.
Across the assays of Olink® Explore 384 Inflammation II, Olink® Explore 384 Oncology II, Olink® Explore 384 Cardiometabolic II and Olink® Explore 384 Neurology II panels, the mean intra-assay and the inter-assay variations observed were 9% and 17%, respectively.
Reproducibility
Inter-site variation (between-site) was also investigated during the validation of Olink Explore at three sites (two service laboratory sites and Olink R&D), to estimate the expected variations in values between different laboratories running the same samples, with different operators using different equipment. The sites were trained and instructed to perform the analysis according to the same routine. Each site performed 6-7 independent runs, and the mean inter-assay variation was 6.6%
Specificity
PEA and specificity – a major problem solved
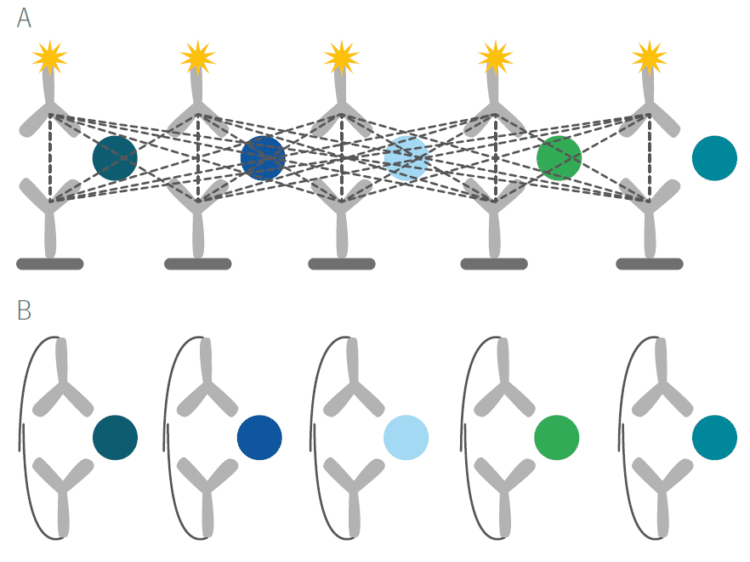
The unique features of PEA technology overcome a long-standing and well recognized issue with immunoassays. With standard assays such as ELISAs, even moderate levels of multiplexing result in cross-reactivity of antibody binding and a loss of specificity of the signals that are detected (Figure A below). By virtue of PEA’s requirement for dual antibody recognition of the target protein and high-fidelity DNA hybridization and detection, any unspecific antibody binding event that may occur will not result in a readout signal (Figure B below).
Specificity validation in Olink Explore
Rigorous specificity testing was used during the development of Olink Explore, both as part of the assay selection process, and afterward as part of the formal product validation procedure.
Assay selection
All assays have gone through a predefined protocol of at least 3 levels of specificity testing:
- First, a screen against several pools of antigens (Ag) is performed (n>100)
- After removal of poorly performing antibodies, a second screen is performed using an expanded set of Ag pools
- Validation of final product design against pools of carefully selected proteins (n=96) including,
* 15 well-known biomarkers from each of the four 384 panels
* 36 proteins with high homology within their protein families
In addition, all Explore assays with equivalent assays in Olink Target 96 panels (n=1118) have previously been tested for specificity against the proteins in the corresponding Target 96 panel.
Overview of specificity validation results
In total, 99.7% of assays (2936/2943) in Olink Explore 3072 exhibited no cross-reactivity according to the tests described.
9 assays revealed a non-specific signal to a closely related protein
The signal contribution at endogenous levels were further investigated and more details are noted on the specific biomarker assay page.
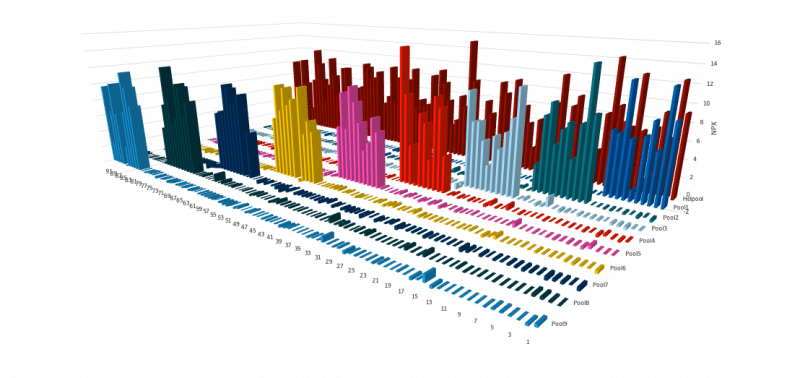
The example graph above shows the specificity testing approach. Each assay is exposed to samples containing either subsets or all of the selected antigens. A given assay should only generate a signal when the corresponding antigen is included in the sample. The lack of unspecific signal indicates that each assay is specific for its target antigen, demonstrating the outstanding specificity of the PEA method at a high multiplex degree.
Questions?
If you have any questions or comments about how we validate our assays, or if there is anything else we can help you with, please contact us.
Olink Target
Analytical measurements
The analytical performance of our panels is carefully validated for sensitivity, dynamic range, specificity, precision, and scalability. You can see how we perform and report on this validation below.
Measuring ranges
Analytical measuring range is defined by the lower limit of quantification (LLOQ) and upper limit of quantification (ULOQ) and reported in pg/mL. The high dose hook effect (a state of antigen excess relative to the reagent antibodies resulting in falsely lower values) is also determined for each analyte. The figure below shows an example calibrator curve and corresponding analytical measurement data.
Precision
All assays are thoroughly validated for precision (repeatability and reproducibility). The figure below shows a representative example of a combined intra-assay and inter-assay variation validation study.
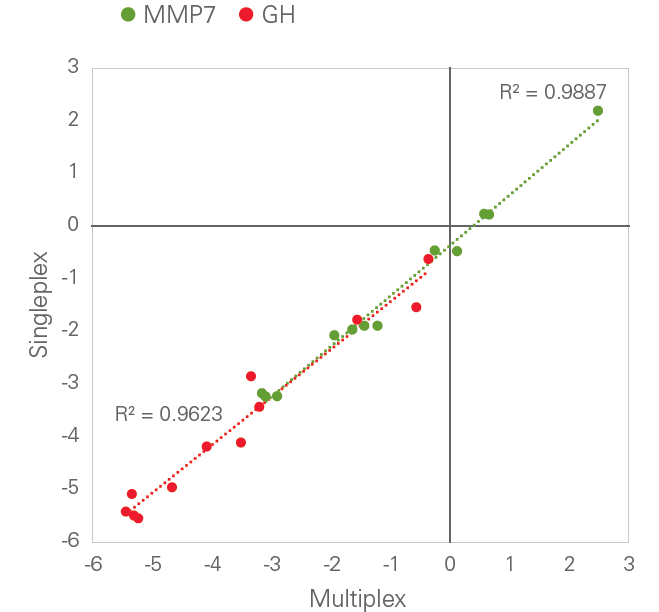
Scalability: Multiplex level-independent performance
Olink’s PEA technology is able to achieve a high level of multiplexing while maintaining exceptional data quality, since unlike in many other immunoassay formats, any antibody cross-reactivity that may occur during the multiplexed assay is excluded from the detection process. This is exemplified in the figure below, comparing dCq-values from single assays for Growth Hormone (GH) and Matrix Metalloproteinase (MMP-7) with the equivalent assays performed in a full 96-plex reaction. The square of the correlation coefficient (R2) value was generated by linear regression.
Specificity
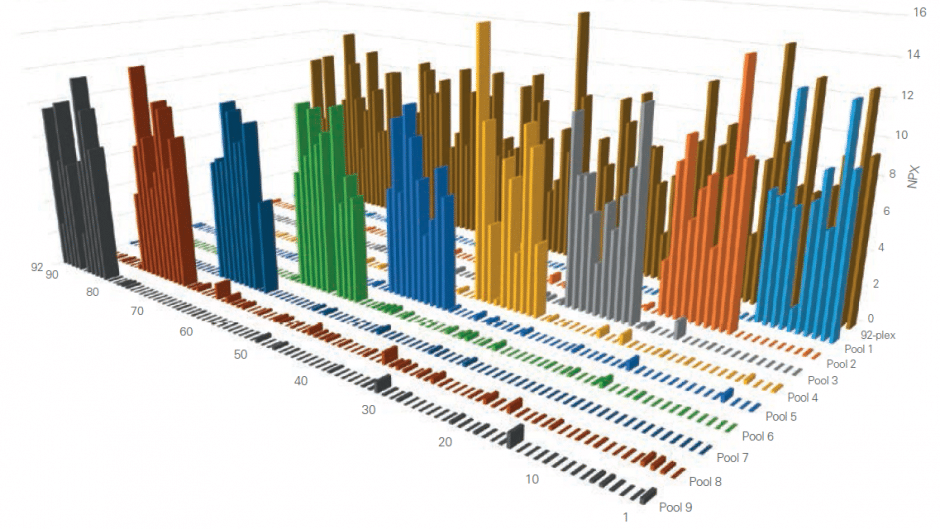
Using Olink’s panels, each biomarker analyte is addressed by a matched pair of antibodies, coupled to unique, partially complementary oligonucleotides and measured by quantitative real-time PCR. This dual recognition, DNA-coupled method provides exceptional readout specificity. Validation of the readout specificity for all our panels is carried out using a simple, sequential approach in which pools of protein analytes are tested with all 92 antibody probe pairs in the panel. The design of this validation study is shown below.
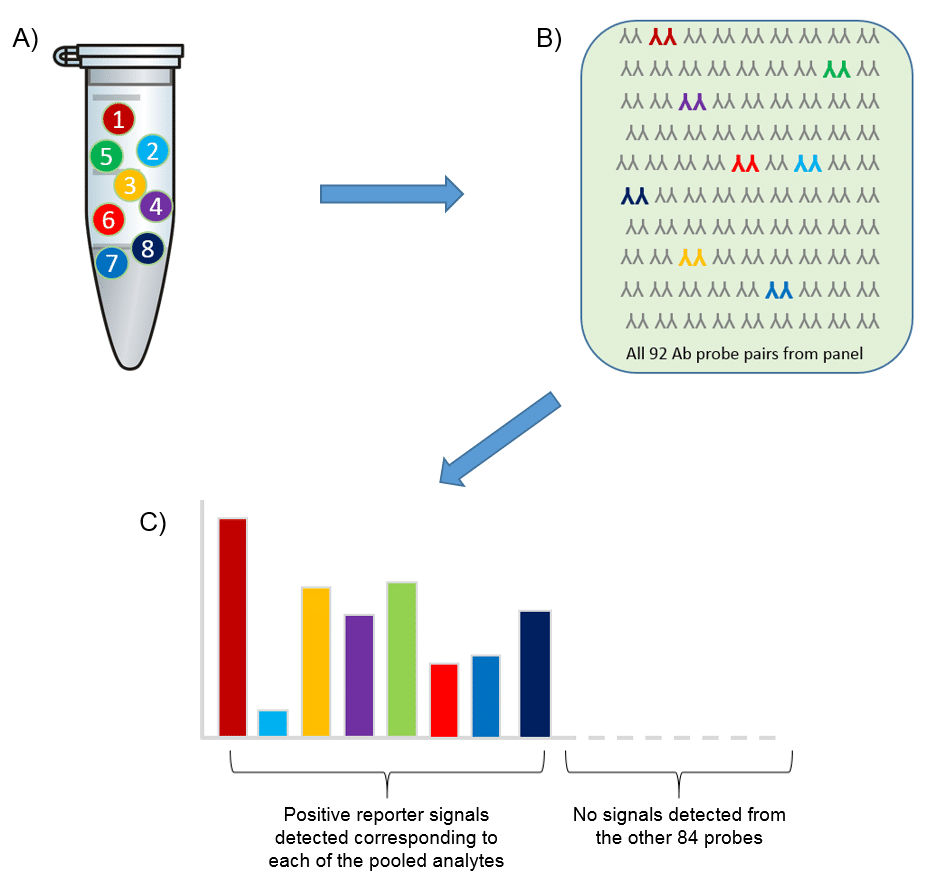
A) Test ”sample” created (pool of full-length recombinant antigens corresponding to 8 of the 92 proteins targeted by the specific panel). B) Test sample of 8 antigens analyzed using all 92 oligo-labeled antibody pairs (Olink probes) C) qPCR readout from all 92 probes detects only those 8 represented by the pooled recombinant antigens. The whole process is then repeated using additional pools of analytes.
The figure below shows the aggregated results from such a study, clearly demonstrating that thanks to our Proximity Extension Assay technology, any antibody cross-reactivity that may occur in the high-multiplex reactions does not affect the specificity of the final readout. This is contrast to other conventional methods such as sandwich ELISA, where antibody cross-reactivity in multiplex assays contributes directly to the detection readout.
Validation Data documents for current Olink panels
The analytical performance of our panels has been carefully validated for sensitivity, dynamic range, specificity, precision, and scalability, and the results are summarized in the Data Validation documents for each panel. To access these documents, please go to the Documents & Downloads page.
Biomarker Validation Data web pages
Detailed validation data and background information for all of the 92 biomarkers in each Olink Target 96 panel are available by clicking on the individual biomarkers in the summary tables that can be accessed from the product page for each individual panel (see Olink Target 96/48 for links to the current panels).