Data generation and QC
Data generation with Olink® Explore
Please note, details related to the Olink Target platform can be found further down this page – go there directly
NPX is Olink’s relative protein quantification unit on a log2 scale. NPX values from Olink Explore are calculated from the number of matched counts (= i.e. the number of sequence reads for each specific combination of sample and assay) from the NovaSeq 6000 or NextSeq 2000 run.
Running the assay
Detection of the digital PEA signal and sample analysis for Olink® Explore are performed via NGS, using Illumina’s NovaSeq 6000 or NextSeq 2000 instruments*. These high-throughput systems enable true multiplexing, with simultaneous detection and readout of 384 analytes & controls in 96/384 samples (36 864/147 456 data points) in each lane. The instruments can process four lanes in parallel, generating 147 456/589 824 data points from a single run.
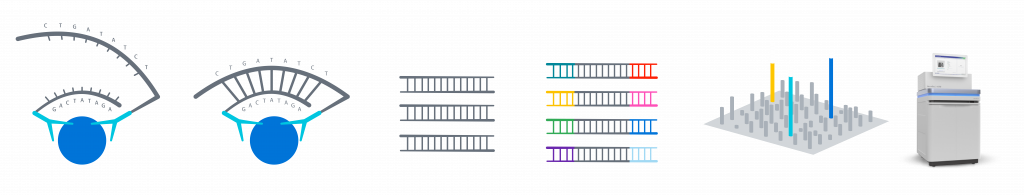
Olink Explore workflow, from immunoassay to NGS readout
About sample volumes:
- Olink Explore technically requires 6 µL of plasma or serum to measure ~3000 analytes.
- Another 7 µL are needed to compensate for dead-volumes in the automated liquid handling system
- Analysis Service requests you actually send 80 µL of each sample in case re-runs are required.
The sample preparation steps take about 24 hours, while the final NGS readout takes less than 12 hours to complete.
Data generation and quality control
Data from the NovaSeq 6000 run is uploaded to the MyData cloud. After this, Olink MyData cloud software processes the data, performs QC-analysis, calculates NPX values and produces an Analysis Report. The cloud software provides Normalized Protein eXpression (NPX) values for further data analysis. This is an entirely new software specially developed for Olink Explore, although most of the functionality is based on the previously used NPX Manager Software that was developed for Olink Target 96 panels.
Olink has developed a built-in QC system using internal controls, enabling full control over the technical performance of assays and samples. Three internal controls are spiked into every sample for each dilution and panel, and are designed to monitor the quality of assay performance, as well as the quality of individual samples:
- Immuno control (incubation step)
- Extension control (extension and pre-amplification step)
- Amplification control (amplification step)
Each sample plate also includes a control strip with the following controls:
- Two Sample controls used to estimate the precision (intra- and inter-CVs)
- Three Negative controls used to set the background levels for each protein assay and to calculate the limit of detection (LOD)
- Three Plate controls used to compensate for potential variation between runs and plates
For more details, see our white paper.
Due to the huge amount of data generated by NovaSeq 6000 instruments, all data storage and analysis is handled by a secure AWS cloud service.
Our Analysis Service labs provide customers with project reports generated using the MyData Cloud software.
For an overview of the practical details involved in ordering a study, sending samples and receiving results using Olink Explore from our in-house Analysis Service labs in Boston MA or Uppsala, Sweden, PLEASE READ OUR GUIDE.
Statistical analysis
If more extensive data analysis services are required, our team of Olink data scientists can help you with customized statistical analysis – see our statistical analysis services.
You may also try our new post-assay statistical analysis app, Olink® Analyze, where you can perform basic statistical analyses and generate heatmap, sample distribution or Principal Component Analysis (PCA) plots yourself.
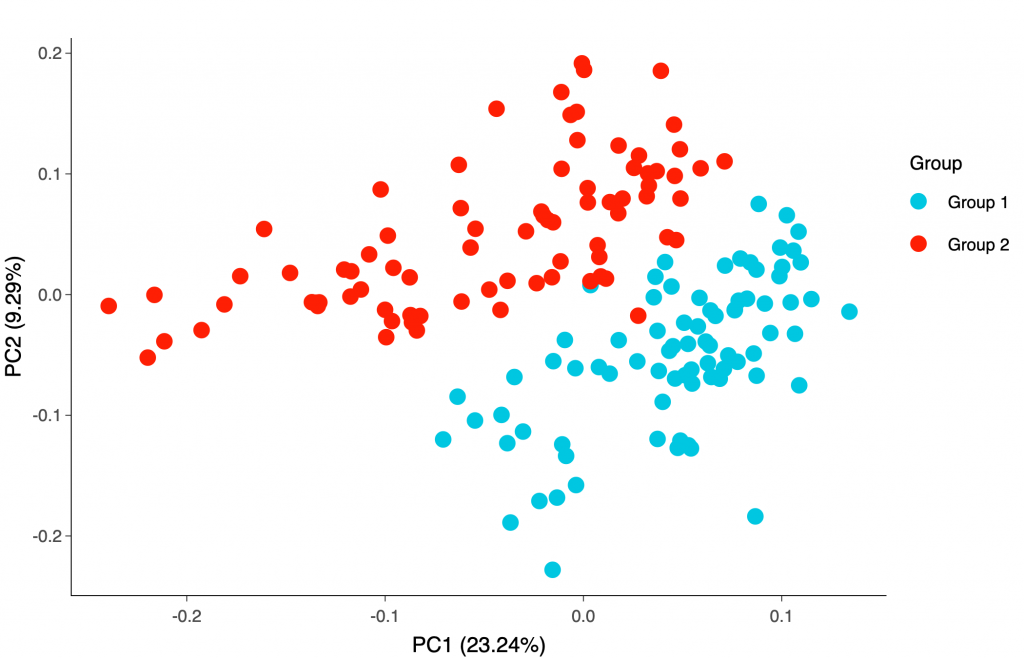
Example of Principle Component Analysis (PCA) plot
Contact us
Questions about Olink Explore?
*”Illumina” and “NovaSeq” are trademarks and the property of Illumina Inc. or their respective owners.