Multiomics identifies LTBP-2 as a new plasma biomarker for pulmonary arterial hypertension
Right ventricular (RV) disfunction is the primary cause of mortality in cases of pulmonary arterial hypertension (PAH), and this work combines tissue-specific transcriptome analysis with circulating proteome profiling. A biomarker has been identified (latent transforming growth factor beta binding protein 2 – LTBP-2) which correlates RV function to human pulmonary arterial hypertension, and is a promising robust circulating biomarker for risk stratification and predicting clinical outcomes.
The problem of pulmonary arterial hypertension
Pulmonary arterial hypertension (PAH) is a condition where small blood vessels in the lung are narrowed, leading to high blood pressure in the pulmonary arteries. The pulmonary arteries carry oxygen-poor blood from the right ventricle of the heart, and right ventricular damage occurs due to this high blood pressure from the lungs. Without treatment, this condition can be fatal, and few of the molecular mechanisms of both initial compensation to RV hypertrophy (called cRV) and later disease progression (called decompensated RV or rRV) are currently known.
As the disease progresses, changes in the damaged heart muscle are reflected in the circulation, including well-known markers brain natriuretic peptide (BNP), and its cleavage product N-terminal fragment of BNP (NT-proBNP). These biomarker measurements are not reliable for the progression of PAH as they lack specificity, with levels known to be associated with left ventricular disease, kidney function, age and other comorbidities.
A multiomics approach to discover biomarkers with diagnostic and prognostic utility
A recent study out of the University of Quebec Department of Cardiology and Pulmonology (Boucherat et al. “Integrated Transcriptome and Proteome Analyses Identify LTBP-2 as a Plasma Biomarker for Right Ventricular Dysfunction in Human Pulmonary Arterial Hypertension”)1 uses a wide multiomics approach including whole transcriptome analysis (RNA-Seq) and LC-MS/MS proteomics approach for relative protein abundance from patient tissue samples (n=60 patient samples in the discovery cohort from Canada, and n=61 patient samples in the validation cohort from the UK).
The patient tissue samples were further divided into cRV and dRV (compensating Right Ventricle, early-stage disease, and decompensating Right Ventricle, progressing later-stage disease), along with healthy control tissue. After determining the intersection of the transcriptomics and mass-spectroscopy-based proteomics analysis from diseased and healthy tissues, the plasma from these respective patient samples were then interrogated using the Olink® Explore 384 Cardiometabolic panel. Figure 1, from the paper’s Extended Data, is reproduced to illustrate the experimental design.
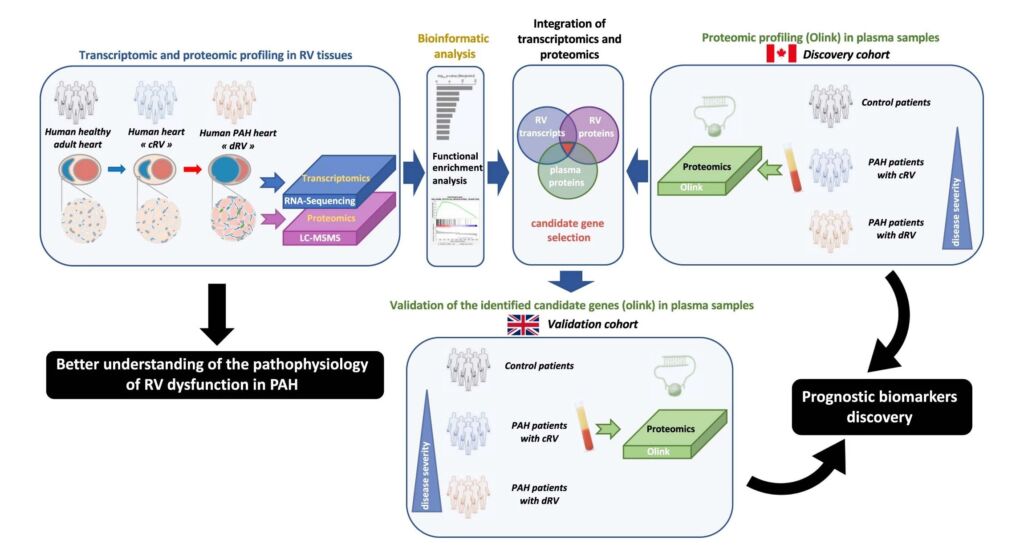
Figure 1: Schematic representation of the experimental design. Abbreviations used: cRV, compensated right ventricle; dRV, decompensated right ventricle; PAH, pulmonary arterial hypertension; RV, right ventricle. From Boucherat et al. Extended Data Fig. 1, available online at https://www.nature.com/articles/s44161-022-00113-w/figures/8
The transcript analysis between healthy, cRV, and dRV samples showed a high number of transcripts that were up- or down-regulated specific to the dRV (the progressive, decompensating form of the disease) tissues. Figure 2, also from the Extended data, illustrates the difference, with each dot representing a single sample. In total 1,226 transcripts were up-regulated and 1,317 transcripts were down-regulated in the dRV group compared to healthy controls.
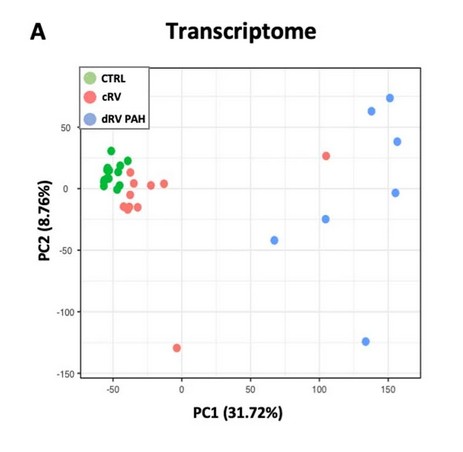
Figure 2: Principal Components analysis of RNA-Seq data, each dot representing a single sample, green represents healthy control samples, red affected compensatory Right Ventricle (cRV) hypertrophy patient samples, and blue affected decompensatory Right Ventricle (dRV) hypertrophy patient samples. From Boucherat et al. Extended Figure 2a, available online at https://www.nature.com/articles/s44161-022-00113-w/figures/9
The LC-MS/MS proteomics approach to these tissues quantified 1,428 proteins across all three types of tissue samples, and the overlap between the transcriptome and the proteome is informative. There are 25 + 33 = 58 genes where the Differentially Expressed Gene (DEG, or mRNA transcript) and the Differentially Expressed Protein (DEP, or protein) were in tandem agreement (both up or down regulated). Another 29 + 57 = 86 DEPs were differentially expressed proteins without agreement to the RNA, and 2 where the differentially expressed RNA went down but the expressed protein in the tissue went up.
These numbers (and the genes in each group) are in Figure 3.
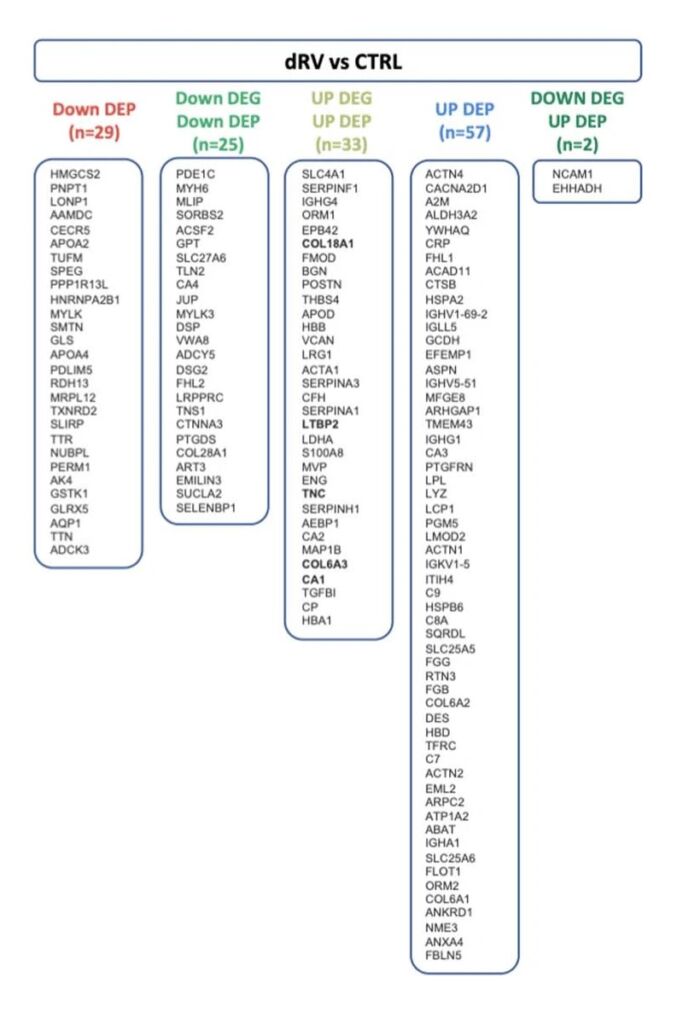
Figure 3: List of genes significantly changed at the RNA or protein level comparing healthy tissue to diseased dRV tissue samples. DEP = differentially expressed protein, measured by LC-MS/MS; DEG = differentially expressed gene, measured by RNA-Seq. From Boucherat et al. Extended Figure 2c, available online at https://www.nature.com/articles/s44161-022-00113-w/figures/9
Through the use of the Olink® Explore 384 Cardiometabolic Panel[2] five proteins were found to be up-regulated in plasma, that also were up-regulated in the DEG analysis as well as the DEP analysis from tissue. These proteins are highlighted in red in Figure 4.
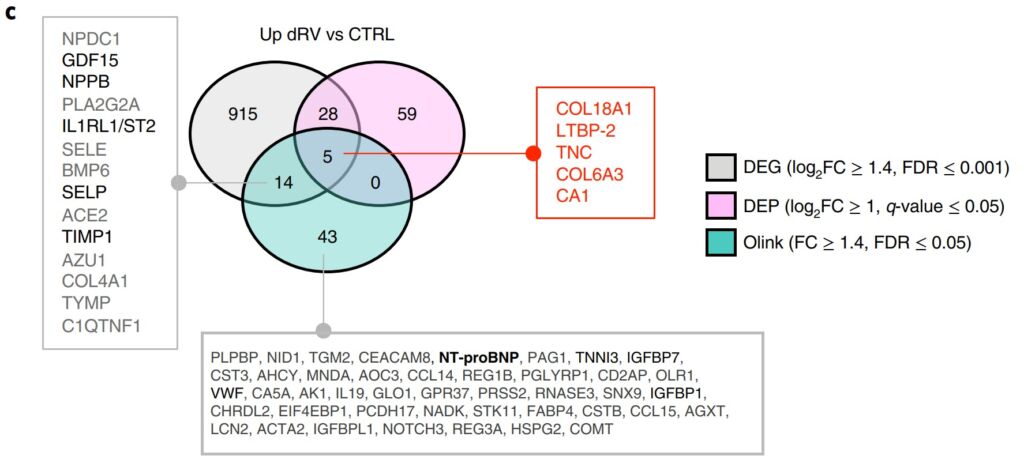
Figure 4: Differentially expressed circulating proteins from plasma of healthy patients (CTRL) and dRV patients (dRV). DEG = Differential Expressed Gene, DEP = Differential Expressed Protein. From Boucherat et al. Figure 3c.1
The presence of the primary marker LTBP-2 was then confirmed in human and animal model tissues by Western Blot and immunofluorescent imaging.
The prognostic utility of LTBP-2 in patient samples
Carrying forward all five biomarkers identified (LTBP-2, COL6A3, COL18A1, TNC and CA1), the researchers had follow-up data for up to 9 years on their respective patient cohorts (31 patients died and another 2 had lung transplants) and had enough statistical power to calculate transplant-free survival using receiver-operator characteristic (ROC) curves. LTBP-2 had the highest area under the curve (AUC) of 0.812, and the four additional markers COL6A3, COL18A1, TNC and CA1had AUC values of 0.716, 0.717, 0.731 and 0.560 respectively. In addition they were able to compare proportional hazard analysis for death or transplantation risk against existing risk score models for PAH (called REVEAL 2.0 and 2015 ESC/ERS risk scores).
The ROC curve for LTBP-2 is illustrated in Figure 5, along with a Kaplan-Meier survival curve.
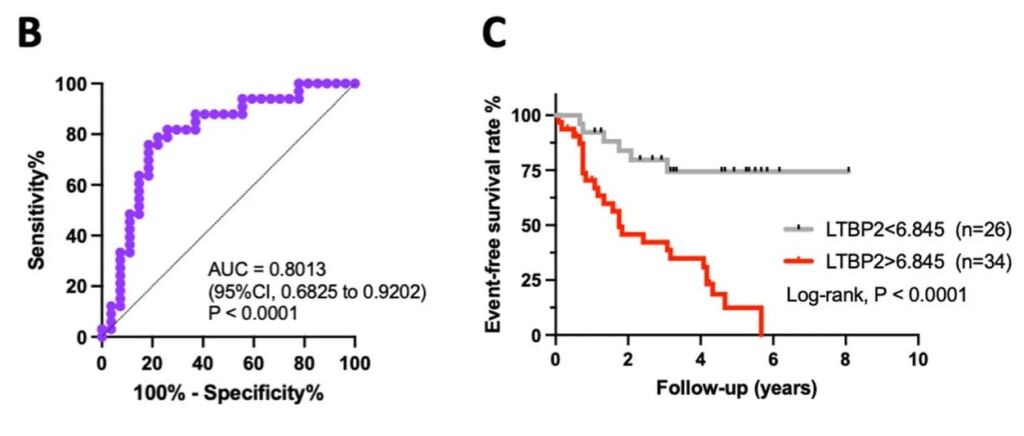
Figure 5: Receiver-Operator Characteristic (ROC) curve for LTBP-2 and Kaplan-Meier survival curve with over to eight years of patient follow-up. From Boucherat et al. Figure 5b and 5c.1
A few caveats and an endorsement
This research is remarkable in its uniting of tissue transcriptomics, tissue proteomics using mass spectroscopy, and circulating proteomics using Olink® Explore along with longitudinal data with patient sample data stretching for over eight years. It is well-known that gene expression transcript levels by themselves are not sufficient to predict protein levels in many biological scenarios[3], but in this study the increased levels of several key transcripts correlated well with overexpressed proteins in both the tissue and plasma of pulmonary arterial hypertension patients. Of the five markers identified, serum LTBP-2 is described as a robust circulating biomarker “intimately connected to cardiac fibrosis, improving risk stratification when combined with the REVEAL 2.0 risk score”.
Two additional markers, COL18A and COL6A3 suggest a hypothesis of the molecular nature of heart muscle inflammation (in particular, the generation of endostatin which has anti-angiogenic properties and endotrophin which is a fibro-inflammatory driver across several diseases).
The researchers in their discussion point out that “using a multi-omics and multi-tissue-based prioritization strategy, we not only confirmed some biomarkers previously characterized but also identified new ones with strong predictive value and that represent potential targets directed at supporting or improving RV function in PAH”.
References
- Boucherat O and Bonnet S et al. Nature Cardiovasc Res Integrated Transcriptome and Proteome Analyses Identify LTBP-2 as a Plasma Biomarker for Right Ventricular Dysfunction in Human Pulmonary Arterial Hypertension 2022 1:748-760. https://doi.org/10.1038/s44161-022-00113-w
- For more information about the Olink Explore 384 Cardiometabolic Panel https://www.olink.com/products-services/explore/
- Liu Y, Beyer A, Aebersold R. On the Dependency of Cellular Protein Levels on mRNA Abundance. Cell. 2016 165(3):535-550. https://doi.org/10.1016/j.cell.2016.03.014

How the proteome behaves in healthy individuals
Clinical research, Multiomics
To achieve the goal of precision medicine, not only do different molecular profiles need to be understood in disease populations, but they must also be understood in the context of healthy populations.

Key proteomics publications from 2020
Proteomics
Welcome to the first post of the all-new weekly Olink to Science! Our customer survey revealed that you would like to know more about the many publications, research, and other science happening at Olink, therefore this blog aims to do just that: keep you informed on the exciting science taking place with our technology.

Protein biomarkers are crucial in early detection of cancer
Clinical research, Oncology, Protein biomarkers
A central premise of precision medicine is to identify biomarkers indicative of disease transitions early on. This is especially important in cancer where early treatment intervention could increase a patient’s chance of survival and reduce the probability of cancer recurrence.

Using PEA and RNA-Seq to study disease pathology
Clinical research, Proteomics
The following study illustrates how transcriptomics and proteomics complement one another to clarify the pathology of a complex, and little understood disease. Atopic dermatitis (AD) is the most common chronic skin condition affecting up to 20% of children and 7-10% of adults, depending on the population.

Olink protein biomarker panel indicates fermented foods fight inflammation
Inflammation, Proteomics
Could food be used to fight chronic disease?

Study identifies proteins involved in immunotherapy response
Oncology, Proteomics
'Ultimately, it is all about understanding and treating patients better in the future.'

Proteins diagnostic of lung cancer up to 5 years before disease onset
Oncology
An earlier Olink to Science blog post covered some amazing research that found that certain blood protein biomarkers have the potential to predict cancer up to 3 years before diagnosis. This may also be the case for lung cancer, as detailed in a recent study by Dagnino and her colleagues, where elevated levels of CDCP1 were detected in participants of a cohort who later developed the disease.

Utilizing proteogenomics technology for novel drug target discovery
Drug discovery & development
High-throughput multiplexed proteomic technology is leading the way to the latest developments in pre-clinical disease analysis in drug discovery. The pharmaceutical industry is now increasing its efforts in the discovery of novel drug targets by using protein quantitative trait loci (pQTLs), which allows for a more confident inference of disease causality and associated protein regulation.

Developing a high-performance biomarker panel for Alzheimer’s disease
Clinical research, Neurology, Protein biomarkers
A simple search of the term ‘scourge of Alzheimer’s Disease’ brings up over half a million website hits. A major disease, about 15% of us that reach the age of 67 to 74, and 44% of those 75 to 84 will develop AD.

How proteomics helped diabetic kidney disease research advance
Clinical research, Proteomics
Dr. Krolewski and his team at the Harvard Medical School found 56 proteins to be significant in diabetic kidney disease patients. Potentially, these could serve as prognostic biomarkers for disease progression and treatment response. This is how adding proteomics to the methodologies elevated their research.