A bioinformatic resource for pan-cancer proteomics
Disease atlas: Cancer
Improving the early, accurate diagnosis of cancer is a high priority goal for oncology researchers and clinicians. Circulating proteins are now at the center of such efforts, providing minimally invasive biomarkers that can reveal the real-time biology that reflects the ongoing disease status. Protein biomarkers may also indicate changes early in the development of the disease that manifest long before clinical diagnosis. Multi-protein signatures can provide superior accuracy in identifying disease cases and help to discriminate among different types of cancer at an early stage.
Olink provides next-generation proteomics solutions to discover and develop such biomarkers, but also enables scientists to frame their own research questions or reference their key findings against premium datasets generated using Olink technology. Data from landmark proteomic studies is openly available to the research community through interactive data stories in Olink® Insight – a powerful online platform designed to empower the interpretation of complex proteomic datasets in the context of existing biological knowledge.
This blog describes just such a resource, based on a remarkable cancer proteomics dataset. The Disease atlas: Cancer interactive data story is built on data from Professor Mathias Uhlén and SciLifeLab in Uppsala, Sweden, who carried out a pan-cancer analysis of protein associations with 15 different cancer types that measured ~1,500 proteins in the plasma from >1,800 patients from the Uppsala-Umeå Comprehensive Cancer Consortium (U-CAN) biobank.
Read more in a new case study!
The proteomics of cancer
The analysis focuses on how protein expression varies among the different cancer types. This enables you, for example, to compare and explore observed protein expression profiles for each cancer type and identify strong biomarkers for each of them. The example below shows how you can select or search proteins of interest to generate NPX distributions and ROC curves.
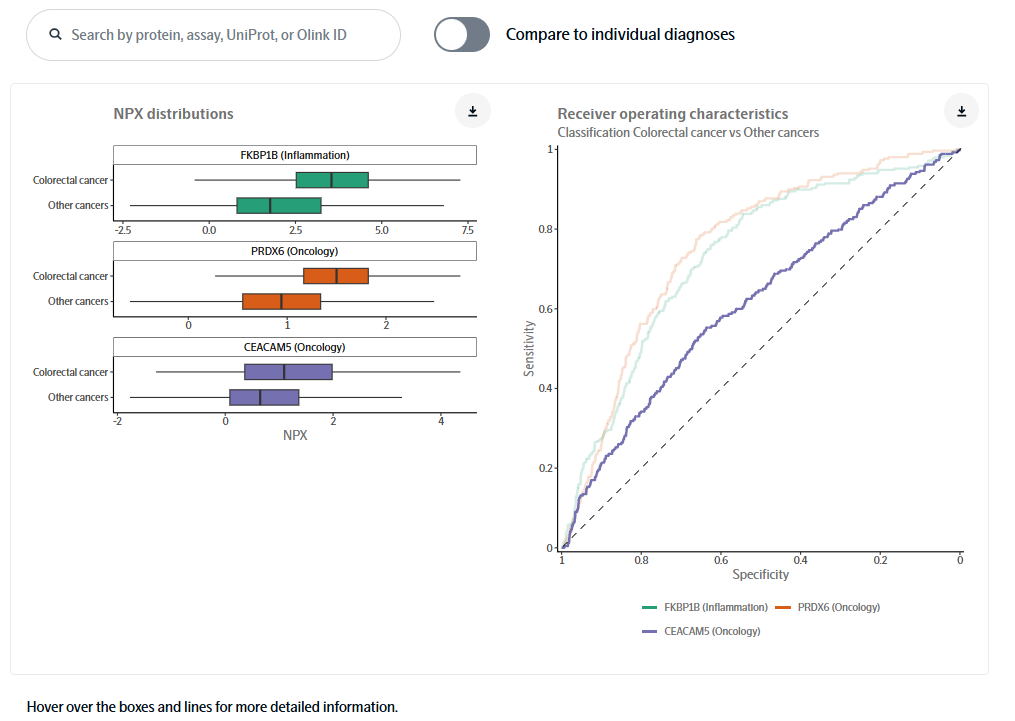
Other examples of the interactive functions include:
- Display the top 10 proteins associated with each cancer, (all differentially expressed markers or only up-regulated markers) -based on Lasso logistic regression.
- Look more closely into any individual cancer type, with a variety of options such as volcano plots, classification models, and more detailed pathway enrichment and annotation (Reactome pathways).
- View receiver operating characteristics (ROC) curve analysis that evaluates how well the selected markers discriminate the specified cancer type from all other cancers.
To learn more about Disease atlas: Cancer and the other key resources in Olink Insight, please download our free Case Study using the link below.
