Olink Data Science Services
At Olink, our dedicated team of experts provides comprehensive statistical analysis and data visualization services to propel your biomarker research forward. By partnering with our specialists, you receive quality data that empowers your discovery process and streamlines decision-making.
At Olink, our dedicated team of experts provides comprehensive statistical analysis and data visualization services to propel your biomarker research forward. By partnering with our specialists, you receive quality data that empowers your discovery process and streamlines decision-making.
Study design
The Olink Data Science Team are here to help you plan and design your study in the best possible way to help ensure a successful project that will enable new discoveries and actionable biological insights.
The team are ready and willing to step in and help at any time during the study and data journey, but it is strongly recommended to involve them at the earliest possible stage of the process to ensure an efficient, optimally planned study.
Why study design is important
A well-designed study sets a solid base to generate reliable, interpretable, and biologically meaningful data. This is particlulary relevant for complex “omics” research where the volume and complexity of data could potentially lead to misleading conclusions if not properly controlled.
By starting with a clearly defined biological question and appropriate cohorts or other sample sources, the study can be designed to control biological and technical variability, minimize bias and ensure appropriate statistical power. Scroll through the information below to see some of the major factors to consider in study design, from project objectives to study group selection, sample collection and handling, statistical power calculations, selection of protein panels and data analysis plan.
The Olink Data Science Team are ready to help you with all of this and more, whether by direct consultations or through appropriate training courses and once again, we encourage you to engage with them at the earliest possible point in your study planning process.
Training to accelerate your transition from proteomic data to biological insights
Data analysis training
There are five tailored sessions (totaling 10 hours) to enhance your understanding of proteomics data output. Each session is two hours long, and the tutorials are based on the R programmatic language and centered around the versatility of the Olink Analyze R package.
Session 1: Definition of Olink NPX data, reviewing approaches to normalization both within a project and across different projects.
Session 2: Dimensionality reduction: Learning how to use PCA and UMAP functions both for data QC and clustering.
Session 3: Introducing differential statistics.
Session 4: Understanding pathway enrichment analysis and leveraging our online bioinformatics app, Olink Insight.
Session 5: Predictive modeling for high-dimensional data, applying machine learning approaches for biomarker selection & outcome prediction, and multiomics integration (this topic requires R programming skills).
Advanced data analysis training
Take your understanding of proteomic data to the next level with three tailored sessions (totaling 6 hours). The training is based on R, so prior experience with R programming is required. In addition, a basic understanding of Olink data analysis is expected, including familiarity with concepts like NPX values, data QC, and normalization.
Session 1: Meta analysis with Olink data – learn how to apply meta-analysis to clarify how specific proteins are differentially expressed between groups across multiple studies.
Session 2: Proteogenomic associations of protein quantitative trait loci (pQTL) and Mendelian Randomization (MR) – Identify genetic drivers of protein changes and their links to disease.
Session 3: Network-based integration (WGCNA, PPI networks) – WGCNA and PPI analyses to provide a systems-level perspective by identifying networks of proteins that are co-expressed and working together, rather than examining them in isolation.
Reporting services
The dedicated experts on the Olink Data Science Team provide comprehensive statistical analysis and data visualization services to propel your biomarker research forward. By partnering with our specialists, you receive quality data that empowers your discovery process and streamlines decision-making. Two main types of data report can be provided, depending on your specific requirements.
Differential data analysis
A report that gives an overview based on study objectives
- Differential expression analysis based on experimental groups such as different treatments, time points, age, sex or other variables.
- Data quality control to determine sample outliers and evaluate global trends within the data.
- Detailed protein expression plots stratified by group for significant assays, or predefined priority assays.
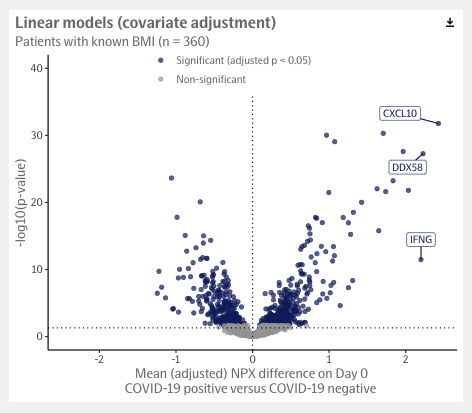
- Volcano plots to visualize the difference in NPX-values between groups by significance for all assays.
- Data visualizations that include a heatmap of significant assays, scatterplots evaluating sample variability, and a principal component analysis (PCA) plot to examine clustering of samples.
See an example of a Differential Data Analysis report with all data visualization and plots included
Normalization and Bridging
A report that provides you with adjusted NPX data normalized across studies run at different times.
- An overview of the datasets, including a table of the overlapping samples and the Sample QC status in each project.
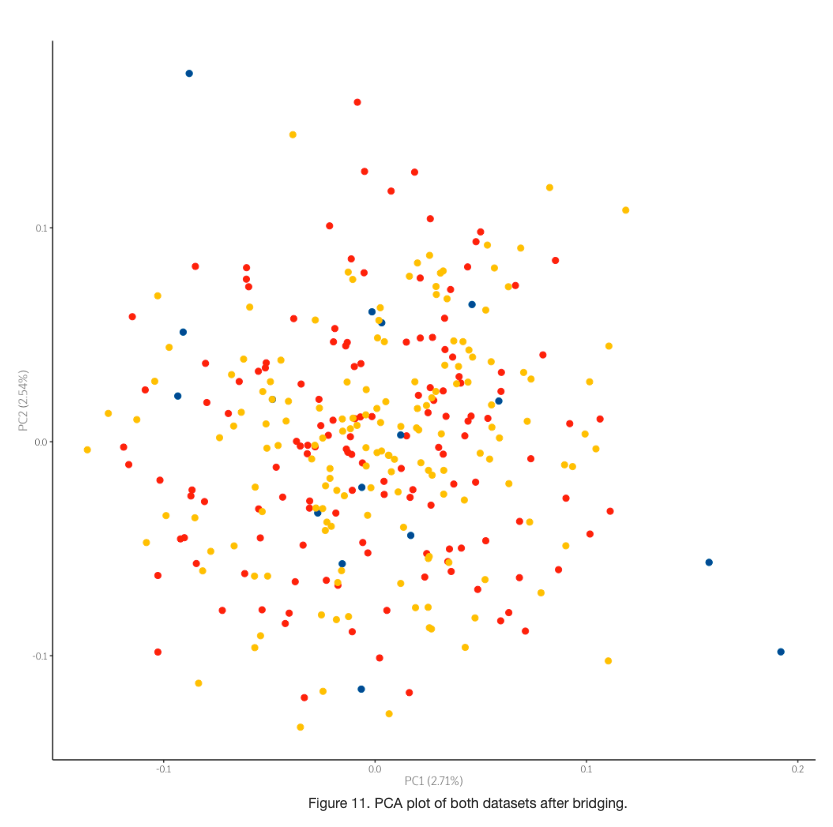
- PCA plots and density plots that will be used to assess bridging quality by comparing plots pre- and post-bridging.
- Violin plots for assays with high adjustment factors.
- A newly compiled file with all datasets normalized towards the data from the original reference study.
See an example of a Normalization and Bridging report with all data visualization and plots included
Data science tools
From study planning to actionable insights, Olink provides biostatistical & bioinformatic expertise, tools, resources, and services to help accelerate your proteomics study and support you throughout your complete data journey.