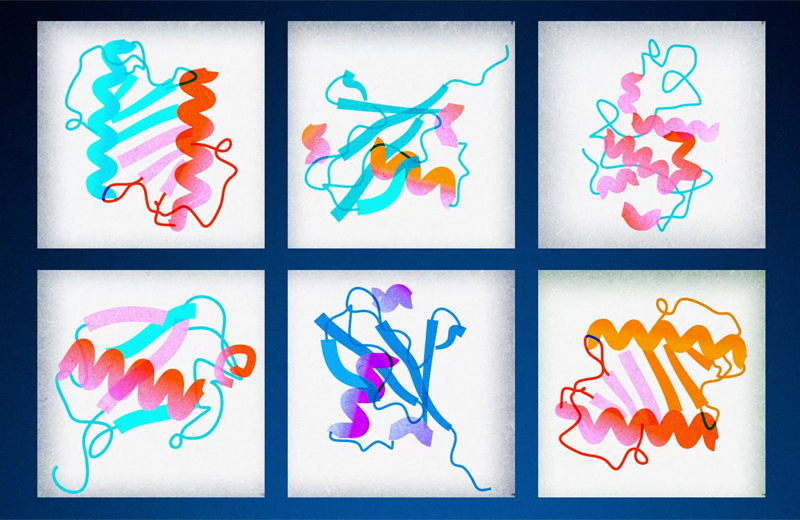


Activating your proteomic data
Learn how the Olink Data Ecosystem supports proteomics research by leveraging one of the largest proteomics studies to date, for your research.
The Olink Data Ecosystem guides and supports you across the proteomics workflow. From study design to data generation, quality control to data integration, normalization, visualization, and biological interpretation, move your research forward confidently.
Whether you’re new to proteomics data analysis or a bioinformatics expert, the Olink Data Ecosystem simplifies proteomics by offering guided workflows, intuitive analysis tools, integration with third-party tools, and access to expert support.
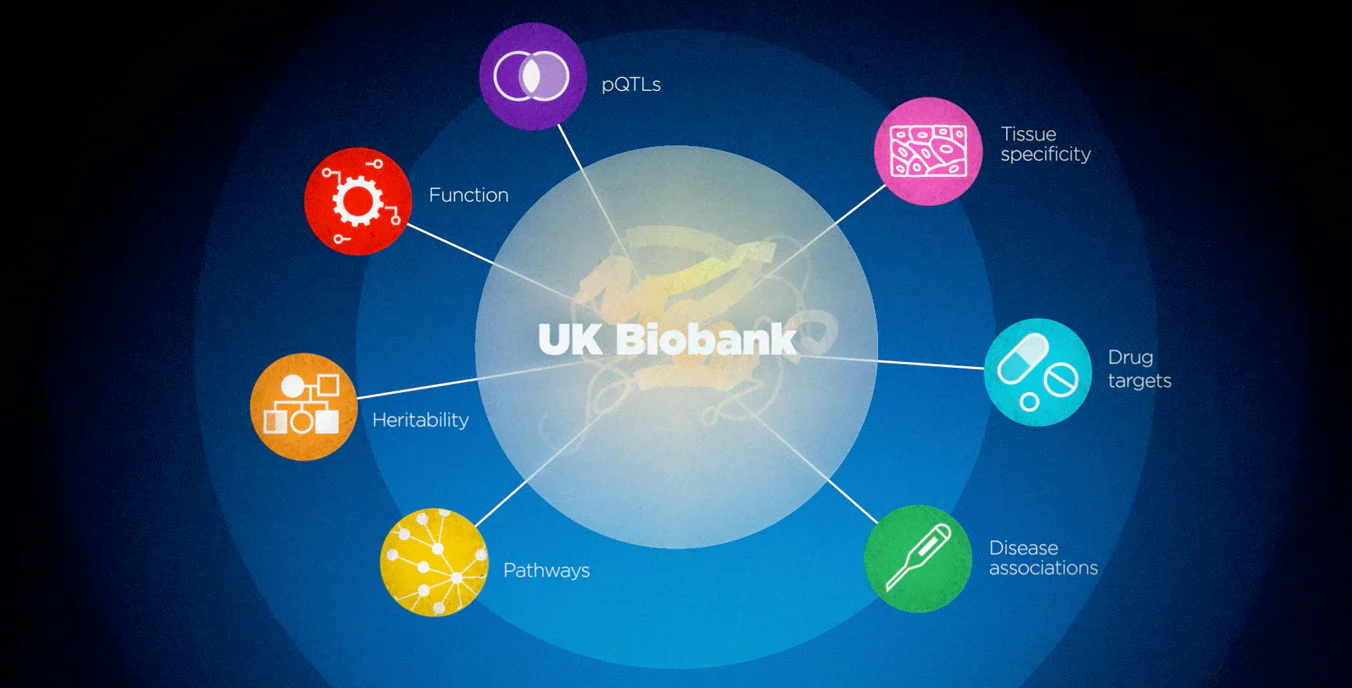
Learn how the Olink Data Ecosystem supports proteomics research by leveraging one of the largest proteomics studies to date, for your research.
High-dimensional proteomics data can unlock powerful biological insights, but the data analysis and interpretation often require specialized bioinformatics support and statistical expertise. Olink proteomics lowers this barrier with intuitive tools, guided workflows, and expert guidance that help you confidently assess data quality, run appropriate analyses, and place findings into biological context.

Data analysis need
How the Olink Data Ecosystem helps
Guided QC and robust workflows to help you confidently integrate proteomics into your research.
User-friendly tools and tutorials empower users of different experience levels.
Olink platform is designed as an integrated ecosystem from study design to interpretation.
Flexible solutions allow data generation across studies of different sizes.
Olink data can be integrated with genomics and other data types to place protein findings in broader biological context.
Discover high-impact studies illustrating how integrated proteomics analyses deliver deeper biological insight across populations, diseases and ageing. These references demonstrate how large-scale proteomics can transform research.

Get tailored support and training from Olink experts for study planning, statistical analysis, reporting, and visualization.